Top takeaways:
- The number of extreme heat days is expected to increase by between 22 – 31 days by the 2050s compared to the historic average of 11 days.
- Seasonal and spatial distribution of temperature increases are projected to be relatively similar, though highly urbanized areas can expect higher temperatures due to Urban Heat Island Effect.
- Businesses that rely on outdoor labour will see increasing impacts of warming temperatures on their workforce. Increasing temperatures will also drive more energy consumption for building cooling during summer months and heatwaves.

This Primer uses the moderate (RCP4.5) and high (RCP8.5) emissions scenarios as a basis for discussion.
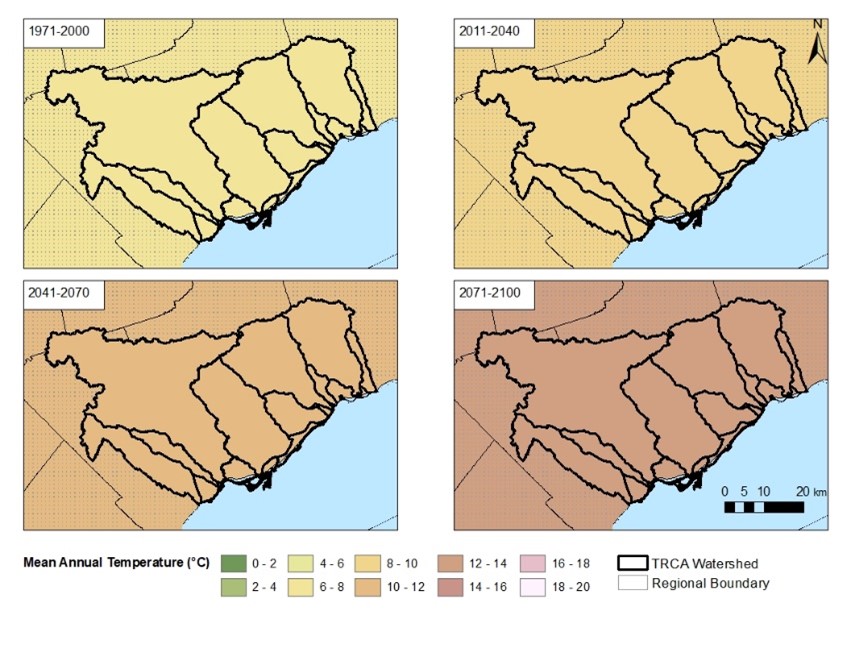
Average annual temperatures are expected to continue increasing across the Toronto region over this century. Between 1971 and 2000, the historic average was 7.3°C. The projections show an increase to an average temperature between 11.6°C and 12.4°C by the 2080s [1]. With warming temperatures comes the increased likelihood and severity of heatwaves and extreme heat events. As evident in Figure 1, changes in temperature under the high emissions scenario are expected to be relatively consistent across the region. These changes may be further exacerbated by the phenomenon known as the Urban Heat Island Effect, which would contribute to even higher temperatures in urban areas due to the higher concentration of paved surfaces and buildings compared to surrounding areas with more natural land cover.
Maximum and minimum temperatures are also expected to increase under both scenarios, driving more extreme hot temperatures in the summer and fewer extreme cold temperatures in the winter. The number of days with maximum temperatures above 30°C (extreme heat days) is expected to increase by 22 – 31 days by the 2050s and between 37 – 41 days by the 2080s, compared to the historic average of 11 days [1].
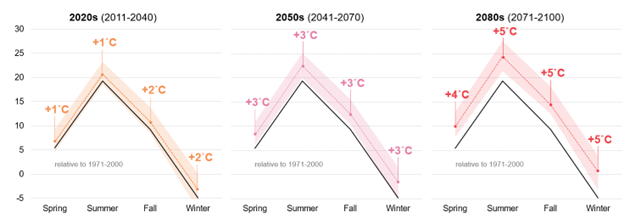
Average maximum summer temperatures are projected to increase by 4.2°C – 5°C by the end of the century [1]. Minimum winter temperatures are projected to warm by about 6°C by the 2080s, rising to an average of -3.1°C under the high emissions scenario [1]. Figure 2 below provides an overview of projected average seasonal temperature and changes relative to the 1971-2000 historical period.

Bottom Line
Projections show an increase in temperatures across the Toronto region over the course of this century. Rising temperatures across all seasons will increase the occurrence of extreme heat days during the summer and lead to a decrease in extreme cold days during the winter. As the region continues to warm, temperature-sensitive natural and human systems will be impacted as they are pushed beyond the temperature tolerances they evolved with.
Partners in Project Green’s Building a Climate Resilient Business Resource Kit provides a foundation in the basics of current climate science, the impacts of climate change on businesses, and mitigation and adaptation strategies. Please explore these resources and connect with us to advance your organization’s climate resiliency.
To learn about the impacts of climate change on business, check out:
[1] Toronto and Region Conservation Authority (TRCA), 2021. TRCA Climate Change Projections under RCP8.5 and RCP4.5 (1971-2100) (Version 1). TRCA Open Data. https://data.trca.ca/dataset/trca-climate-change-projections

